
Section 1: Introduction — Why the Histogram Matters More Than You Think
If there’s one tool in photography that completely changed the way I expose an image—and saved more photos than I care to admit—it’s the humble histogram. It’s not glamorous. It’s not a new lens or a shiny leather camera bag (you know I love those). But it is one of the most reliable ways to make sure your image is properly exposed, especially when the back of the camera lies to you with overly bright previews or tricky lighting. You can bring your photography to the next level by mastering the histogram.
I didn’t appreciate the histogram at first. I thought I could trust my eyes. Then I shot a sunrise over Mount Hood, watched the colors dance across the LCD, and went home to Lightroom only to discover huge blown-out highlights. That was the day I started paying attention.
Now, whether I’m photographing a bald eagle against a bright sky back home in New York, shooting a lava-rock coastline on Oahu, or capturing the soft glow of sunset reflections in the sand, I’ve learned that the histogram is my truth-teller. It tells me what’s really happening in my exposure—no guesswork, no surprises later.
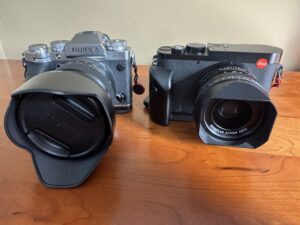
And in this post, I’m breaking it all down: what the histogram actually shows, how I use it with both my Leica Q3 and Fujifilm X-T5, how to avoid clipping, and how it can elevate your photography whether you’re shooting landscapes, wildlife, or everyday moments at home.
Section 2: What a Histogram Actually Is (In Normal-Person Terms)
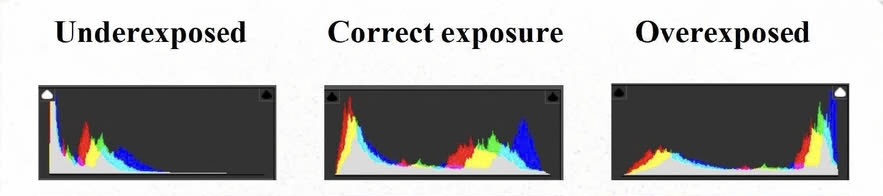
A histogram is simply a little bar graph that shows how the light is distributed in your photo—from the darkest shadows on the left to the brightest highlights on the right. That’s it. It’s not a test you can fail, and it’s not something only pros use. It’s just a visual map of your exposure.
When I first started using one, I expected something complicated and science-y. Instead, it clicked immediately:
- Left side = shadows
- Middle = midtones
- Right side = highlights
If the graph is piled up on the left, your image is probably dark.
If everything is shoved to the right, it’s likely too bright.
And if the graph spills off either side—well, that’s usually where trouble begins.
The beauty of the histogram is that it doesn’t care about misleading LCD brightness, harsh sunlight on your screen, or those moments when you think the image “looks fine” until Lightroom tells you otherwise. It’s honest.
On my Fujifilm X-T5, the live histogram pops up right in the corner of my EVF, so I can see exposure changes in real time as I adjust shutter speed or ISO. On my Leica Q3, it’s equally clean and straightforward—one glance and I know whether my highlights are safe or if I’m pushing the exposure a bit too far.
It becomes second nature once you start using it, and honestly, it takes some pressure off. Instead of guessing, I can focus on the creative stuff: the scene, the light, the story I’m trying to tell.
Section 3: Why the Back of Your Camera Lies to You
I wish I could say I always trust the back of my camera. I don’t. And honestly, neither should you.
The LCD is a wonderful tool, but it’s also a bit of a drama queen.
It changes its appearance depending on:
- the brightness of the sun,
- your screen’s own brightness setting,
- the angle you’re holding it at, and
- whether you’re squinting through sunglasses on a beach in Maui.
I’ve had images look perfect on the screen—warm, balanced, beautifully exposed—only to bring them into Lightroom later and realize the sky is blown out or the shadows have swallowed all the detail. That’s especially true with travel photography, where you’re constantly bouncing between bright mid-day light and deep shade, or wildlife photography where a bald eagle might be perched in dark branches with a bright sky right behind it.
The Fuji X-T5 is better than most at giving you a fairly accurate preview, and the Leica Q3 has one of the best, most natural screens I’ve ever used… but even those aren’t telling the whole truth. The preview you see is actually based on the JPEG, not the RAW file. That JPEG has your film simulation, white balance, tone curve, and other settings baked in—so it may be brighter, moodier, punchier, or softer than the actual RAW data.
In other words, the LCD is showing you a “recipe”… not the true ingredients.
The histogram, on the other hand, gives you the data as it is. No flattery, no drama, no digital makeup. It tells you whether your highlights are safe, whether your shadows still have detail, and whether you’re pushing the exposure too far in either direction.
It’s the one thing that keeps me honest—especially when I’m shooting something fleeting, like an eagle taking flight or a fast-moving cloud that might disappear in seconds.
Section 4: Understanding Clipping (and Why It Matters)
Clipping sounds dramatic, but all it really means is that part of your image is missing detail — either in the shadows or the highlights. Think of it like overcooking dinner: once it’s burnt, you can’t scrape the char off and pretend it didn’t happen.
On the histogram, clipping shows up when the graph slams into either edge:
- Left edge = shadow clipping (lost detail in the dark areas)
- Right edge = highlight clipping (blown-out bright areas)
Once that graph “spills over,” the information is gone. No amount of Lightroom magic can restore feathers that weren’t captured in the first place.
And believe me… this was learned this the hard way.
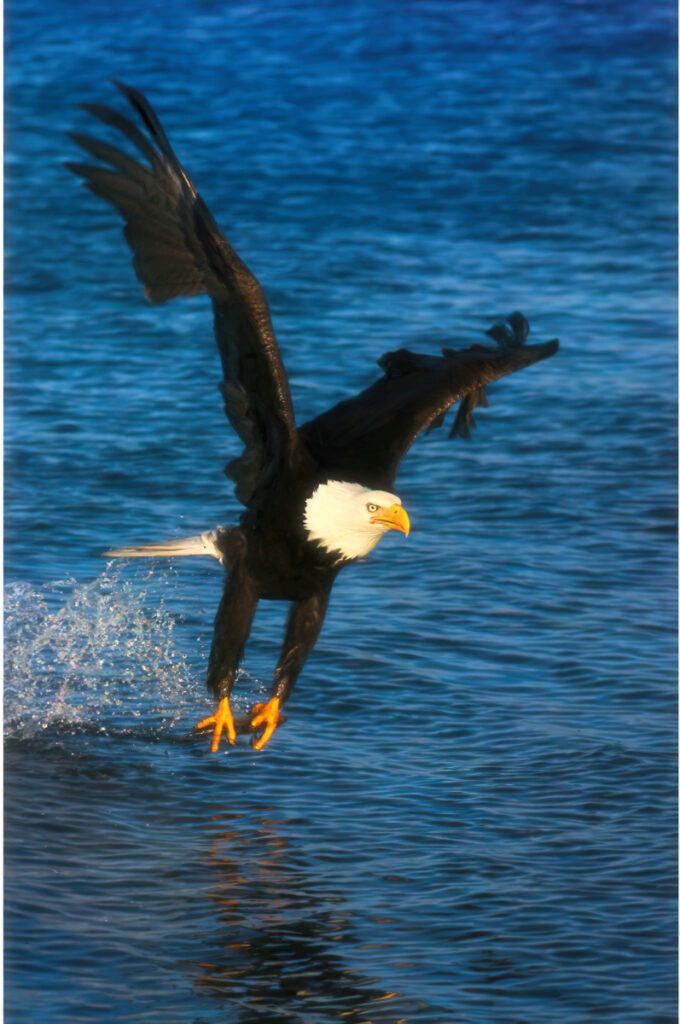
I once had the perfect shot of a bald eagle flying — wings wide, talons tucked, lit beautifully against a bright sky. I was ready to frame it. Ready to print it. Ready to brag about it. And then I pulled it into Lightroom.
The eagle’s white head had completely blended into the sunlit sky. No detail. No contrast. Just a glowing white blob where those gorgeous feathers should have been. That’s highlight clipping in its purest, most heartbreaking form. And once it’s clipped, it’s gone for good.
This is why I’m so obsessed with the right side of the histogram when I’m photographing eagles, herons, or anything with bright highlights against a bright background. A bald eagle’s head is notoriously easy to overexpose — just ask anyone who’s tried it. The moment that graph starts pressing against the right edge, I dial the exposure down immediately.
My Fujifilm X-T5 makes this easier with its highlight warnings (“blinkies”), and the Leica Q3’s clean histogram display gives me instant feedback. If I keep the graph just inside that right edge, I know those delicate white feathers will still have detail.
Finding that balance — a histogram with breathing room on both ends — gives you the full tonal range of the scene. Not too dark, not too bright, and no heartbreaking surprises when you get home.
Section 5: Using the Histogram in Different Shooting Situations
Once you understand what the histogram is telling you, it becomes one of the most practical tools you have in the field. I use it differently depending on the kind of photography I’m doing—landscape, wildlife, travel, or even those quiet everyday moments close to home.
Here’s how I rely on it in different situations.
Landscape Photography: Big Dynamic Range, Big Decisions
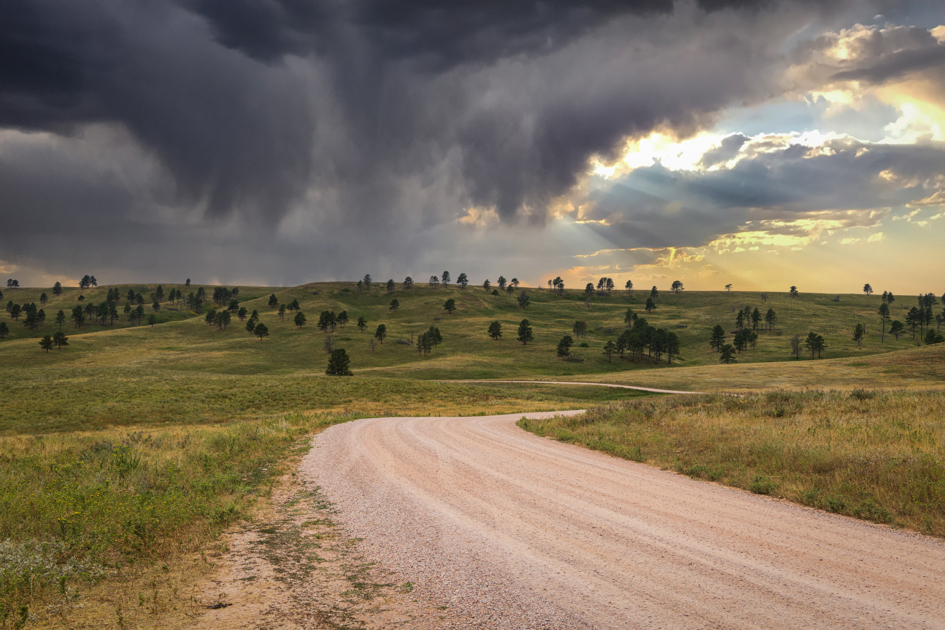
Landscapes can be sneaky. They look calm and simple, but they often have huge dynamic range—bright skies, deep shadows, reflective water, sunlit mountains, you name it.
When I’m photographing something like sunrise at Mount Hood or sunset reflecting off wet sand, I watch the histogram more than the LCD. If the graph is pushing too far to the right, I know I’m about to blow out the sky. If it’s buried to the left, the foreground will be too dark to recover.
I adjust until I see a nice, centered “mountain” of tones—one that still leaves space on both sides. That’s usually where the magic happens.

Wildlife Photography: Fast Moments, Tricky Lighting
Wildlife is where the histogram saves me the most heartache.
Think of photographing a bald eagle’s white head against a bright sky or a heron perched in dappled afternoon sunlight. Exposure can swing in an instant. The back of the camera might look okay, but the histogram tells me the truth.
If that graph starts kissing the right edge, I know those white feathers are at risk. And after losing what could have been the best eagle photo I’ve ever taken—feathers erased, head blown into the sky—I learned to trust the histogram over my eyes every single time.
I shoot, adjust, shoot again. The Fuji X-T5’s live histogram helps me react fast, and the Leica Q3’s warning indicators are crystal clear.
With wildlife, moments are fleeting. You don’t get a do-over when an eagle decides to take flight or a moose walks out of frame. The histogram makes sure the exposure is right the first time.
Travel Photography: Changing Light, Moving Quickly
Travel photography is a constant dance with changing light. One second you’re in bright sun along the Oahu shoreline, the next you’re in the shade of a local coffee farm—or ducking into a shop along the Pinellas Bike Trail in Florida (and yes, I’ve ridden right into that lighting challenge more than once).
The LCD might trick you because your eyes are adjusting to the environment. But the histogram doesn’t care if you’re in shade, sun, or shooting from inside a bike helmet.
If the graph is too far right, I bring the exposure down before the sky vanishes. If it’s too far left, I brighten until I see usable midtones. This helps me capture consistent, balanced images even when the light is shifting every few steps.
Everyday Photography: Home, Family, Creative Moments
Even at home—photographing reflections in a puddle, a quiet moment with a cup of coffee, or the way winter light hits my backyard—I keep an eye on the histogram.
It keeps the highlights soft, the shadows detailed, and the tones clean enough that the edit feels effortless later. It lets me be creative without worrying about technical mistakes.
Using the histogram doesn’t mean fussing over every shot. It means checking the data, adjusting quickly, and then getting back to what matters: telling the story. Once you get in the habit, it becomes second nature.

Section 6: Exposing to the Right (ETTR) — When and When Not to Use It
At some point in your photography journey, you’ll hear someone confidently say, “You should always expose to the right.” And while ETTR can be helpful, it’s not a one-size-fits-all rule. In fact, used at the wrong time, it can ruin a shot faster than you can say “blown highlights.”
So let’s break it down in real-world terms.
What ETTR Actually Means
“Exposing to the right” simply means brightening your exposure so the histogram leans slightly toward the highlight side — but without clipping. The idea is that brighter exposures contain more data and cleaner shadows, which gives you more flexibility in post-processing.
In theory, that sounds wonderful. In practice… well, it depends on what you’re photographing.
When ETTR Works Beautifully
ETTR shines when you’re photographing scenes with:
- soft light,
- low to moderate contrast,
- no extreme highlights, and
- subjects that won’t vanish the moment you adjust your settings.
For example:
- A soft sunrise at Trillium Lake
- A misty mountain scene
- A shaded forest trail
- Even everyday photos at home with gentle window light
In these situations, brightening the exposure until the histogram sits comfortably to the right gives you cleaner files and smoother edits. If the brightest parts still have detail, you’re good to go.
When ETTR Will Absolutely Betray You
Now, here’s where ETTR becomes dangerous — and sometimes downright destructive:
Wildlife with bright highlights.
A bald eagle’s white head? A snowy egret? A heron with sunlit feathers?
ETTR will push those whites straight into clipping before you have time to say, “Wait—did I just lose all the detail?” (Trust me, I’ve lived that moment. I still think about that perfect flying eagle photo I lost to blown highlights.)
Scenes with intense sun.
Bright skies, reflections on water, backlit subjects — these all create highlight danger zones.
High-contrast travel scenes.
Think Oahu’s lava rock coastlines in harsh sun or bright reflections on wet sand during sunset. ETTR here can destroy your sky in seconds.
In these cases, I do the opposite of ETTR:
I protect the highlights first — no matter what.
If that means the histogram leans left and the shadows run a little deep, that’s fine. I can work with shadow recovery. But blown highlights? Those are gone forever.
Finding the Practical Middle Ground
Here’s my simple rule:
Expose as brightly as you can without sacrificing important highlights.
That means:
- checking the histogram,
- watching for clipping,
- dialing exposure down the moment the right side touches the edge,
- and prioritizing your subject over any blanket “technique.”
With wildlife and travel photography, I rarely ETTR in the purest sense. I aim for a balanced histogram, not a pushed one. The Leica Q3 makes this easy with its clean highlight warnings, and the Fuji X-T5’s live histogram helps me react quickly.
And honestly? This approach has saved more eagle photos, beach scenes, and mountain views than any photography “rule” ever has.
Fujifilm X-T5: The Live, Always-There Truth Teller
Fuji’s live histogram might just be one of my favorite features on the entire system. It sits neatly in the corner of the EVF or LCD and updates in real time as I turn the aperture ring, change my shutter speed, or bump the ISO.
This makes the X-T5 incredibly intuitive for fast-moving scenes:
- Wildlife in flight (especially those unpredictable bald eagles)
- Changing light along scenic drives
- Street or travel photography where I’m moving quickly
With Fuji, the histogram feels like a constant conversation. I make a small adjustment, the histogram jumps or settles, and I know instantly if I’m safe or flirting with clipping.
Fuji also shows highlight warnings—the “blinkies”—which let me know the second I’ve lost detail in bright whites. This is exactly how I avoid repeating my infamous “perfect eagle photo with a missing head” tragedy. If I see blinkies on the eagle’s crown or wingtips, I dial the exposure down before taking another shot.
The X-T5 rewards a responsive shooting style. It’s fast, it’s informative, and it keeps me honest when the light is shifting second by second.
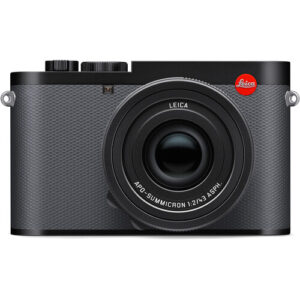
Leica Q3: Clean, Minimal, and Surprisingly Precise
Shooting with the Leica Q3 is a totally different experience. The interface is beautifully simple — almost meditative — and the histogram is no exception. It’s clean, easy to read, and feels more like a quick confirmation tool instead of something I watch constantly.
With the Leica, I treat the histogram like a quiet partner I check in with:
- before I start shooting a scene,
- after a quick burst of frames,
- and anytime the light shifts more dramatically than my eyes expect.
It’s especially helpful for:
- High-contrast scenes (sunset cliffs, reflections, harsh mid-day beaches)
- Minimalist compositions where tones matter
- Slow, deliberate shooting where I want precision
The Q3’s highlight warnings are subtle but effective, and because the camera’s lens and sensor produce such beautifully clean files, I’m more comfortable letting the histogram lean slightly left rather than risk losing highlights. If my shadows get a little deep, the RAW files handle recovery wonderfully.
When I’m shooting mindfully — taking my time, soaking in the moment, really exploring the light — the Leica’s histogram lets me focus on the creative side without overthinking the technical stuff.
Two Cameras, One Visual Language
Even though Fuji and Leica present the histogram differently, the purpose is the same: protect the highlights, keep your tones in check, and make sure the story you’re capturing translates cleanly in the final image.
Fuji is my fast-talking, real-time coach.
Leica is my quiet, wise editor.
Using both has trained my eye to notice subtle changes in light long before they appear on the screen — which is maybe the greatest gift of all.
Section 8: Practical Tips to Build the Histogram Habit
It’s easy to understand the histogram in theory… and then completely forget to use it once you’re out in the field chasing a photo. Don’t worry—I did the same thing. For months, I’d get home, open my files, and think, “Why didn’t I just check the histogram?” (Usually followed by coffee, sighing, and a quiet promise to do better next time.)
Over time, I found simple habits that made using the histogram feel natural—something I do without thinking, the same way I instinctively check my shutter speed or glance at the corners of my frame.
Here’s what helps:
1. Turn on the Live Histogram (If Your Camera Has It)
On the Fujifilm X-T5, this is a game changer. Seeing the histogram as you change exposure settings trains your brain incredibly fast. It becomes second nature, like watching a fuel gauge as you drive.
Even a quick glance tells you:
- “Highlights are safe.”
- “Shadows are getting deep.”
- “Oops, I just blew out half the sky.”
The Leica Q3 doesn’t show a live histogram in the same way, but its clean display makes it easy to check after a shot, which leads to…
2. Make It Part of Your ‘Shoot → Check → Adjust’ Rhythm
Once I frame a shot and take the first image, I immediately:
- Check the histogram
- Adjust exposure
- Shoot again
This works beautifully with both Fuji and Leica, and it’s especially helpful when the light is unpredictable—like photographing wildlife at sunrise or shooting along a shady trail in Hawaii where clouds are constantly sliding across the sun.
3. Protect the Highlights First, Always
If you just remember one thing from this entire post, let it be this.
Highlights are the first to go—and once they’re gone, they’re gone.
Shadows? They’re often recoverable.
Highlights? They vanish faster than a bald eagle deciding it’s done being cooperative for the day.
If your histogram shows anything slamming into the right edge, lower your exposure immediately. This one habit has saved more of my photos than any fancy camera setting.
4. Create a Mental “Comfort Zone”
Every photographer eventually develops a personal sense of what a good histogram looks like.
For me:
- I want a nice “hill” or “wave” of tones.
- I want some breathing room on both edges.
- And if the brightest highlights sit close to the right side but not clipped, I know I’m right where I need to be.
You’ll find your own comfort zone over time, and once you do, checking the histogram becomes nearly effortless.
5. Don’t Obsess — Use It as a Guide, Not a Final Verdict
Some scenes are naturally dark (forest trails, twilight, silhouettes). Others are naturally bright (beaches, snow, midday clouds). The histogram won’t always look perfectly centered—and that’s fine.
If the scene is supposed to be dark, your histogram will lean left.
If it’s full of bright light, it’ll lean right.
Your job isn’t to force it into the middle—it’s to make sure your important details are protected.
Once I learned this, I stopped “fixing” scenes that weren’t broken.
6. Revisit Your Photos Afterwards
This one might sound tedious, but it helps enormously.
When you’re culling or editing, stop occasionally and compare:
- the image
- the histogram you captured
- how the exposure actually turned out
I can’t tell you how many “aha” moments I’ve had doing this. It speeds up your learning curve faster than anything else.
7. Let the Histogram Support Your Creativity
This is my favorite part.
Once you trust the histogram to take care of the technical side, your brain relaxes. You stop worrying about blown highlights and start focusing on:
- timing
- storytelling
- reflections
- color
- composition
- the emotional moment in front of you
It turns a technical tool into creative freedom.
And honestly, that’s when photography starts to feel really fun.
Section 9: When the Histogram Might Fail You
As much as I rely on the histogram—and as many heartaches as it has saved me—there are moments when it’s not the perfect guide. Just like any tool, it has limits. And understanding those limits will save you just as many photos as learning how to read the histogram in the first place.
Here are the situations where the histogram can lead you astray—or at least needs a little backup.
1. When You’re Shooting RAW but Your Camera Shows a JPEG Histogram
This is the big one.
Almost every camera (Fuji and Leica included) bases its histogram on the JPEG preview, not the RAW file. That means your film simulation, contrast curve, highlight/shadow settings, and even your white balance all influence what the histogram looks like.
On Fujifilm, this matters a lot. Velvia, Classic Chrome, and some of the more contrasty sims can make the histogram look more extreme than what’s actually in your RAW file. You might think you’re clipping when you’re not. Or worse, you might think you’re safe… and your highlights are already gone.
One thing that has helped me tremendously:
I’ve found that using Fuji’s Standard (Provia) film simulation gives me a much more accurate, realistic histogram. It’s less contrast-heavy and closer to the true RAW data, which makes the histogram a whole lot more trustworthy in fast-changing light.
The Leica Q3’s JPEG preview is beautifully natural, but it can still exaggerate contrast. That’s why I always check both the histogram and the actual image when the light is tricky. It’s a two-step system that has saved many wildlife and travel shots.
2. When the Scene Is Intentionally Dark or Intentionally Bright
Silhouettes, night photography, dim indoor scenes, bright beaches, snowy mountains—these subjects naturally produce histograms that lean dramatically to one side. And that’s okay. If you try to “fix” the histogram, you may ruin the artistic intention of the shot.
But here’s the twist most people don’t expect:
If you’re creating a silhouette, you may actually want to expose a little more to the right.
Not to brighten the subject, but to protect the sky. Pushing the histogram slightly right (without touching the highlight edge) keeps the sky rich and colorful, especially during sunrise or sunset.
So:
- Want a pure-black silhouette? A left-leaning histogram is fine.
- Want a silhouette with beautiful sky color? Push slightly to the right and protect those highlights.
This is one of those times where the histogram is a guide—not the judge and jury.
3. When You Have Mixed Light the Histogram Can’t Separate
A single histogram summarizes the entire frame. It won’t tell you where the highlights or shadows are located within the photo.
This is exactly how I lost that “perfect” bald eagle shot—wings perfect, pose perfect, everything perfect… except the white head completely blended into the bright sky. The histogram looked mostly fine. The image was absolutely not fine. See Photographing Eagles: Lessons from the Riverbank.
That’s why I rely on:
- highlight warnings (“blinkies”),
- shadow warnings,
- and a quick glance at the photo itself.
The histogram can’t show localized problems, so this is where your experience really takes over.
4. When You’re Photographically Rushed
We’ve all been there.
The eagle launches.
The light changes.
The heron dives.
The clouds move.
The bus driver says, “We’re leaving in five minutes.”
In these moments, there’s simply no time to study the histogram. You shoot first, check second, adjust on the fly, and pray your instincts are sharp.
When everything is happening in seconds, the histogram becomes a quick follow-up tool—not your first line of defense.
5. When Extreme Color Trips the Camera Up
Bright reds, neon lights, saturated blues, and some intense sunsets can make the histogram look stranger than the scene actually is. Cameras interpret luminance differently across certain colors, which means the graph doesn’t always match what your eyes see.
I use the histogram as a guide in these moments, but I trust my eyes—and the image—just as much.
6. When Using ND Filters or Long Exposures
Very dark ND filters can mess with the accuracy of the preview and histogram. Sometimes the graph will look underexposed even when the final long exposure is perfectly balanced.
In these situations, I rely on:
- test shots,
- highlight warnings,
- and zooming into tricky areas.
The histogram is helpful, but not definitive.
7. When Your Experience Simply Knows Better
This is the moment every photographer eventually reaches.
You see the light.
And you understand the scene.
You know exactly how you want the final image to feel.
And even if the histogram is nudging you in another direction, your creative instincts might be right. The histogram supports your vision—it doesn’t replace it.
Section 10: Wrap-Up — Let the Histogram Support Your Creativity
When I first started paying attention to the histogram, I treated it like a test I had to pass. Now, it feels more like a quiet guide in the background—reassuring me that the technical side of my exposure is solid so I can focus on the fun part: creating photographs that feel true to the moment.
Whether I’m photographing a bald eagle against a bright winter sky at home in New York, a soft sunset reflection on the Oregon coast, or the deep greens of an Oahu coffee farm, the histogram helps me protect the highlights, keep the shadows rich, and walk away knowing I captured the story I saw.
But the real magic happens once it becomes a habit.
It slips into your workflow naturally—just a quick glance before you take a shot, a gentle correction afterward, and the confidence that you’re getting the most out of the light in front of you.
And when the histogram does fail you (because it will), your experience fills the gaps. That’s the beautiful balance between technical and intuitive photography. Both matter, and both make you a stronger, more confident storyteller.
Explore More: My Mastering Photography Series
If you’re diving deep into the craft of photography, here are more posts from my Mastering Travel Photography series — each one designed to help you grow your skills, build confidence, and see the world through a more creative lens.
- Mastering Travel Photography: Tips and Tutorials for Mastering the Road Less Traveled – My cornerstone guide to photographing off-the-beaten-path moments with confidence, creativity, and intention.
- Mastering Composition on the Road – How to build stronger, more compelling images while traveling—or even in your own backyard.
- Mastering Using Reflections in Travel Photography – Transform puddles, windows, and water into storytelling tools that elevate your images.
- Mastering Travel Photography for Beginners: Learning to see the World Through Your Lens – A friendly starting point for anyone stepping into photography for the first time.
- Mastering Shooting in Low Light – Practical tips for handling tricky lighting—from dim restaurants to golden-hour mountain views.
- Mastering Light in Landscape Photography – Understand how natural light shapes your landscape images and learn to work with it, not against it.
- Mastering Storytelling on the Road: Turning Every Trip into a Captivating Travel Narrative – Capture emotion, mood, and meaning in your images—whether you’re on the road or close to home.
- Mastering The Art of Mindful Photography – Slow down, breathe, and create with clarity, intention, and a whole lot less stress.
- Mastering the Art of Wildlife Photography – From reading animal behavior to protecting highlights (and eagle feathers), this post helps you stay ready for the moment.
- Mastering the Art of Patience in Wildlife Photography – Wildlife isn’t in a hurry—so learning to slow down is half the craft.
- Mastering RAW + JPEG on the Road – Discover when shooting both RAW and JPEG helps your travel photography
Follow along for more Mastering Photography posts and travel adventures:
